The script can be downloaded here and contains the following code:
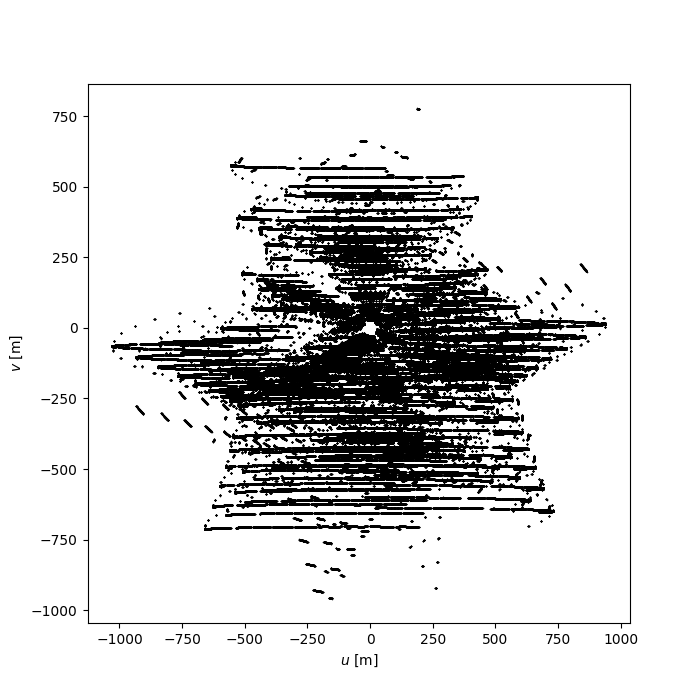
importmatplotlib.pyplotasplt# Read the data from the measurement settb.open(vis)uvw=tb.getcol("UVW")tb.close()# Split out u, v and wuu,vv,ww=uvw# Make the plotfig,ax=plt.subplots(nrows=1,figsize=(7.0,7.0))ax.scatter(uu,vv,s=1.5,rasterized=True,linewidths=0.0,c="k")ax.set_xlabel(r"$u$ [m]")ax.set_ylabel(r"$v$ [m]")plt.savefig("baselines.png:)